As is typically the case, there is more to the story than meets the eye. Last week, it was noted again, that despite what appears to be a fairly strong fundamental environment, prices remain less than robust. This incongruity is a problem for any analyst worth his or her salts, and it's even more difficult for us lesser learned students of the market to comprehend.
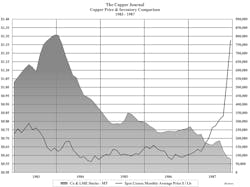
So, what’s the answer? A look back in time often helps us to understand what seems like a complex and inexplicable situation. For example, copper experienced a similar disconnect from 1983 to 1986, as the Copper Price & Inventory Comparison Chart below illustrates. At that time, as we are experiencing now, there was more involved than just low inventories and low prices. From 1981 to 1982 the global economy was in a recession, but the global copper industry was in a depression – a very deep one.
Following the run up in oil prices from the late 1970’s, tight monetary policies were enacted to combat inflationary pressures.
December 1980 saw the Prime Lending rate at a record high 21.5%; building and construction activity fell precipitously; the unemployment rate shot up to 10.8% in December 1982, and although it began to decline from that high, it nevertheless remained above 7% through 1986. As for copper, domestic consumption of refined metal fell 18% in 1982, with global consumption off 4.5%. Clearly, moral was low, and it took a long while for the pessimism to dissipate. Likewise, although the fundamentals began to improve for industrial metals, it would take time for confidence to return, and for prices to recover. As the chart illustrates, when copper finally hit the “Tipping Point” in 1987, prices made up for lost time in very short order.
Today we are in the midst of a trade war, that has taken a severe toll on all involved, and contributed to negative sentiment on a global scale. Over the weekend, however, it was announced that a "temporary cease fire" was declared between the United States and China, so perhaps we will begin seeing some light at the end of this dark tunnel.
John Gross is publisher of The Copper Journal. If you would like to learn more about profitably managing your wire and cable inventory, hedging strategies or gaining additional insight into metals pricing, email John by clicking here or calling him at 631-824-6486.


