Phoenix’s Maricopa County Tops Nation in Population Growth Once Again
Tracking the number of residents moving into or out of a market can give you an idea of its growth potential. When new residents move into an area, they need housing and they may be potential customers for a town or city’s retail, commercial, educational and other institutional services; workers at area businesses; and members of local houses of worship and other civic organizations. This creates new demand for stores, offices, schools, universities, houses of worship, doctors’ offices and hospitals and other community buildings.
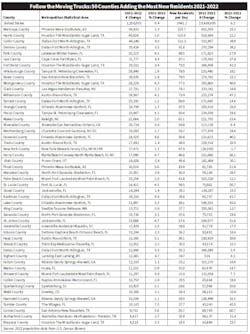
To get a sense of just how large an increase that is, you can look at the data in terms of the number of new residents moving into the county each day. Roughly 156 new residents moved into Maricopa County each day, making it one of only three counties in the United States topping the 100-new-resident plateau. Harris County in the Houston MSA (125 new residents) and Collin County (121 new residents) in the Dallas MSA were the only other counties in that elite club. As you will see in the chart on page 2, the other Top 10 counties in terms of 2022 population growth were in the Lakeland-Winter Haven, FL, MSA; Cape Coral-Fort Myers, FL, MSA; Tampa-St. Petersburg-Clearwater, FL, MSA; and San Antonio-New Braunfels, TX, MSA.
Of course, folks moving into all of these Sunbelt locations had to be leaving other cities, and the counties that saw the biggest population declines last year were in the Los Angeles, Chicago, New York, Philadelphia and Detroit metros. Tallying the biggest declines were Los Angeles County, which lost 90,704 residents last year; Chicago’s Cook County, which lost 68,314 residents; and three counties in New York City: Queens County (-50,112 residents); Kings County (Brooklyn) (-46,970 residents); and Bronx County (-41,143 residents). Lost Angeles County lost and average of 249 residents each day while Cook County’s daily loss rate came in at roughly 187 residents.
Not all of the population news was happening in the largest markets. It’s also interesting to look at population in smaller metros, and the U.S. Census Dept. provides data on what it calls micropolitan areas, which have less than 50,000 in population but have one urban cluster of at least 10,00 people. Bozeman, MT, saw the biggest growth with an annual increase of 1,806 residents. Over the past 10 years, this beautiful city in southern Montana has seen its population grow by +34.8%, with 32,230 new residents moving into the area to enjoy the spectacular mountain scenery, skiing and world-class trout fishing on the Gallatin River.
Other micropolitan markets that have seen big population increases over the past 10 years include Jefferson, GA (+23,076 residents); Kalispell, MT (+20184 residents); Rexburg, ID (+18,269 residents); and Hilo, HI (+17,116 residents).
Click here to download a spreadsheet with population data for more than 1,000 counties.
About the Author
Jim Lucy
Editor-in-Chief
Over the past 40-plus years, hundreds of Jim’s articles have been published in Electrical Wholesaling and Electrical Marketing newsletter on topics such as the impact of new competitors on the electrical market’s channels of distribution, energy-efficient lighting and renewables, and local market economics. In addition to his published work, Jim regularly gives presentations on these topics to C-suite executives, industry groups and investment analysts.
He launched a new subscription-based data product for Electrical Marketing that offers electrical sales potential estimates and related market data for more than 300 metropolitan areas, and in 1999 he published his first book, “The Electrical Marketer’s Survival Guide” for electrical industry executives looking for an overview of key market trends.
While managing Electrical Wholesaling’s editorial operations, Jim and the publication’s staff won several Jesse H. Neal awards for editorial excellence, the highest honor in the business press, and numerous national and regional awards from the American Society of Business Press Editors. He has a master’s degree in Communications and a bachelor’s degree in Journalism from Glassboro State College, Glassboro, N.J. (now Rowan University).

