Electrical Marketing’s Leading Economic Indicators - Aug. 26, 2022 Update
Building permits sag in July
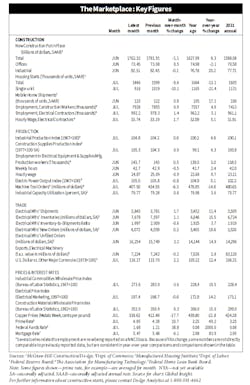
Privately‐owned housing units authorized by building permits in July were at a seasonally adjusted annual rate of 1,674,000, -1.3% below the revised June rate of 1,696,000, but +1.1% above the July 2021 rate of 1,655,000. According to the U.S. Census Bureau, single‐family authorizations in July were at a rate of 928,000, -4.3% below the revised June figure of 970,000.
The Producer Price Index (PPI) for inputs to nonresidential construction — the prices charged by goods producers and service providers such as distributors and transportation firms — dropped -1.3% from June to July, but remained +14.6% above its July 2021 level, according to an analysis of the government’s latest PPI data by Associated General Contractors (AGC).
The PPI for diesel fuel fell -16.3% in July but remained +71.3% above its July 2021 level. Steel mill products fell -3.7% in price last month and increased +6.4% year-over-year. The index for lumber and plywood decreased -0.5% in July and fell -7.7% over 12 months. Copper and brass mill shapes fell -9.7% for the month and -7.9% over the past year. Prices for plastic construction products increased +1%.
Conference Board’s U.S. leading indicator slides again in July
The Conference Board’s Leading Economic Index (LEI) for the U.S. decreased by -0.4% in July 2022 to 116.6 (2016=100), after declining by -0.7% in June. The LEI was down by -1.6% over the six-month period from January to July 2022, a reversal from its +1.6% growth over the previous six months.
“The U.S. LEI declined for a fifth consecutive month in July, suggesting recession risks are rising in the near term,” said Ataman Ozyildirim, senior director- economics, for the Conference Board. “Consumer pessimism and equity market volatility as well as slowing labor markets, housing construction and manufacturing new orders suggest that economic weakness will intensify and spread more broadly throughout the U.S. economy. The Conference Board projects the U.S. economy will not expand in the third quarter and could tip into a short but mild recession by the end of the year or early 2023.”
AIA’s Billing Index for July continues to decelerate but still points toward growth in the construction industry
The AIA Architecture Billings Index (ABI) score for July was 51 points. Published monthly by the American Institute of Architects (AIA), the ABI is a leading economic indicator of construction activity. While the July score is down from June’s score of 53.2 points, it still indicates stable business conditions for architecture firms (any score above 50 indicates an increase in billings from the prior month). Also in July, both the new project inquiries and design contracts indexes moderated from June but remained strong with scores of 56.1 points and 52.9 points, respectively.
“Despite architecture services employment recently surpassing pre-pandemic levels, the ABI score this month reflects the slowest growth since January, and marks the fourth straight month with a lower score than the previous month, indicating a slowing trajectory in billings activity,” said AIA Chief Economist, Kermit Baker. “With a variety of economic storm clouds continuing to gather, we are likely looking at a period of slower growth going forward.”

