Using Location Quotients to Uncover Potential Hot Spots for Industrial Sales
Every Metropolitan Statistical Area (MSA) has its own distinct economic personality, and sometimes you can use market data to find unique characteristics that can lead to new sales opportunities or a more strategic use of company resources in those metros.
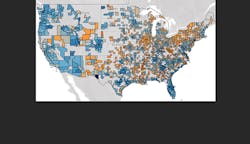
Location quotients (LQs) are a data tool you can use to find out which industries dominate a local economy. The U.S. Bureau of Labor Statistics (www.bls.gov) offers location quotients that compare key economic indicators at the county, MSA, state and national level, including employment, wages and number of establishments for dozens of individual industries classified by NAICS (North American Industry Classification System) code. According to BLS, “Location quotients compare the concentration of an industry within a specific area to the concentration of that industry nationwide. If an LQ is equal to “1,” then the industry has the same share of its area employment as it does in the nation. An LQ greater than “1” indicates an industry with a greater share of the local area employment than is the case nationwide.”
One application for this date in the electrical market is to find out which local markets may have more potential customers for a specific product. Let’s say you are an electrical manufacturer launching a new product specifically designed for the oil & gas industry. You can go use the BLS’ QCEW Local Quotient data to see which counties, MSAs and states have a high proportion of oil & gas sales employment or companies compared to the national average. This data might help you concentrate your sales force’s selling time in the market areas with the highest LQs for the oil & gas market.
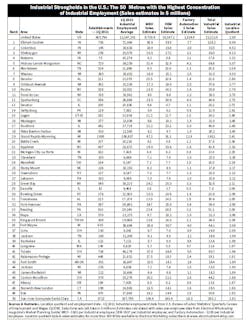
The chart at the bottom of this page shows the 50 markets with the highest LQs in industrial employment. They aren’t necessarily the MSAs with the most industrial employees — they are the metros with the highest proportion of industrial employment when compared to the national average. You might be surprised to learn that the Elkhart-Goshen, IN MSA has an LQ of 6.06 for industrial employment. That’s an exceptionally high proportion of industrial employment compared to its total employment, and its LQ for this sector is six times is higher than the overall U.S. LQ for this area. Thirty-seven MSAs have industrial employment LQs of 2.0 or more, which means they have twice the concentration of industrial employment as the United State as a whole. Columbus, IN (4.52); Sheboygan, WI (4.13); Kokomo, IN (3.32); and Hickory-Lenoir-Morganton, NC (3.07) were also at the top of the list for industrial employment LQs by MSA. You can find the industrial employment LQs for 1Q 2021 for more than 300 MSAs at www.electricalmarketing.com.

