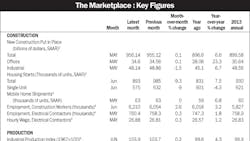
Please note: Some rows and columns were misaligned in the printed version of this table. Those errors have been corrected in this version. EM's editors regret the errors.
*Several series related to employment are now being reported on a NAICS basis. Because of this change, some numbers are not directly comparable to previously reported data, but are consistent in year-over-year comparisons and comparisons shown in the table.
Sources: 1) McGraw-Hill Construction/Dodge; 2) Dept. of Commerce; 3) Manufactured Housing Institute; 4) Dept. of Labor; 5) Federal Reserve Board; 6) The Association for Manufacturing Technology; 7) Federal Home Loan Bank Board. Note: Some figures shown—prime rate, for example—are averaged for month. NYA—not yet available SA–seasonally adjusted. SAAR–seasonally adjusted annual rate. Source for chart: Global Insight. For further information about construction starts, please contact Dodge Analytics at 1-800-591-4462
