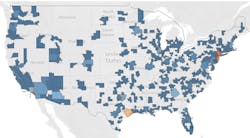
When you take a step back and think about how the electrical wholesaling industry supplies electrical products to thousands of electrical contractors, facility maintenance and purchasing personnel, utilities and other end users in 50 states, it might seem like electrical sales potential would be quite decentralized.
Wrong. In fact, it’s quite the opposite. Electrical Marketing’s editors recently crunched some numbers to estimate U.S .electrical sales potential when the 2Q 2019 employment data for the construction and industrial industries was recently released by the U.S. Bureau of Labor Statistics. We found that when you look at what Electrical Marketing has defined as Core Electrical Sales Potential (the combination of the electrical contractor and industrial customer segments that easily accounts for 70% to 75% of all electrical sales through electrical distributors), 16 Metropolitan Statistical Areas (MSAs) in just three states — California, Florida and Texas — probably account for an estimated 36% of all Core Electrical Potential. If you add in the two other largest MSAs, New York and Chicago, that percentage jumps to 49%. As you can see in the chart on page 2, 17 MSAs have more than $1 billion in Core Electrical Sales Potential, and six of these MSAs are located in the three states mentioned above. The MSAs in these three states are:
California. Los Angeles-Long Beach-Anaheim; Riverside-San Bernardino-Ontario; Sacramento-Roseville-Arden-Arcade; San Diego-Carlsbad; San Francisco-Oakland-Hayward; and San Jose-Sunnyvale-Santa Clara.
Florida. Fort Lauderdale-Pompano Beach-Deerfield Beach; Jacksonville; Miami-Fort Lauderdale-West Palm Beach; Orlando-Kissimmee-Sanford; Tampa-St. Petersburg-Clearwater; and West Palm Beach-Boca Raton-Delray Beach.
Texas. Austin-Round Rock; Dallas-Plano-Irving; Houston-The Woodlands-Sugar Land; and San Antonio-New Braunfels.
Here’s another statistical fact to consider. Whenever a market experiences a dramatic shift in contractor or industrial employment, it can have a direct impact on its electrical sales potential. EM readers who utilize our sales-per-employee multipliers updated annually for the electrical contractor and industrial markets know that each employee at an electrical contracting firm represents an estimated $66,313 in sales potential, and that in the industrial market, each employee represents between $108 and $825 in sales potential, depending on if the electrical business at the account is in the MRO (maintenance and repair operations); OEM (Original Equipment Manufacturer) or factory automation segment.
That means for electrical contractors, which can easily account for between 45% and 50% of the typical full-line distributors ‘sales, an increase of just 100 employees at electrical contracting firms in a market can mean $6.63 million in additional sales potential, while a 1,000 employee swing — which happened over the past year in six metros — can mean $66.3 million more in electrical potential.
These metros account for a surprisingly large share of the overall market. If you look at the industry from a national perspective, it may be an interesting cross-check to see if these MSAs account for a similar percent of your overall business. If you don’t do business in one of the metros in the chart, downloading the latest Core Electrical Potential data for all 50 states and more than 300 other metros available may be helpful if you need to analyze your business mix in other metros or states. Just click click on this link for an Excel .csv file. To see a table of the 50 largest markets when measured by this metric, just click on the green box below.

