Latest from News

ID 49224902/ © Wavebreakmedia Ltd | Dreamstime.com
salesperson_typing_on_computer___id_49224902__wave
www.datawrapper.de
totalelectricalsalesestimates2023metrolevel_1920
Photo © 226496518 Mohd Izzuan Ros
acquisitions_2023_photo_226496518__mohd_izzuan_ros
Illustration © 19276996 / Dirk Erck / Dreamstime.com
people_onthe_move_illustration_19276996__dirk_erck
Photo 87684009 © / Sculpies / Dreamstime.com
housing_market_photo_87684009__sculpies__dreamstim
Photo 199231482 © Hye Jin Kang / Dreamstime
prices_cost_rising_photo_199231482___hye_jin_kang_
Photo 7507349 © Cornelius20 / Dreamstime.com
construction_landscape_photo_7507349__cornelius20_
© Endeavor Business Media
em08232024promo
Image

EM Price Index Down 0.2% in June

July 27, 2012
Electrical Marketing’s Electrical Price Index continued to slide in June

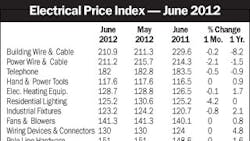
Electrical Marketing’s Electrical Price Index continued to slide in June, falling 0.2%. The EPI is now down -0.3% year-to-year compared to June 2011. The categories with the biggest declines were residential lighting (-4.2%); power wire and cable (-2.1%); air conditioners (-2%); and lamps (-1.4%). Appliances (+1%) were the only category to increase.

Note: All EPI series represent Global Insight aggregates of Bureau of Labor Statistics’ (BLS) producer price indices (PPIs). The revised data partly reflect redefinitions of specific PPIs by the BLS, but mostly reflect the rebenchmarking of all EPI price series to a 1997 base year. The four following EPI series have been affected by BLS redefinitions: boxes, conduit (fittings), non­metallic conduit, and generators. Sources: U.S. Bureau of Labor Statistics; Global Insight