Renewables: New Facilities Under Construction & Approved
Folks at the nation’s electric utilities are probably pretty familiar with much of the data on the generation and consumption of electricity that the federal government’s Energy Information Administration (EIA) keeps track in its monthly and Annual Electric Generator Reports.
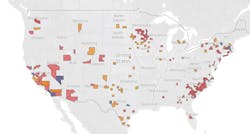
EIA’s most recent data, published sevearl weeks ago, offers good insight into the renewable generating facilities either underway or recently approved. The map below show the location of wind, photovoltaic (PV) and battery facilities, and if you click on this link it will take you to an interactive map that offers some key details on these renewable plants.
Although federal subsidies for the construction of these facilities aren’t quite what they had been in years past, there are still some very large projects underway or in the pipeline. We counted 17 solar projects of at least 100 MW and 41 wind farms in various stages of construction or consideration.
These are large projects. As a point of reference for wind farms, the Department of Energy says a 1.5 MW commercial-scale wind turbine in a moderately windy area (with a 35% capacity factor) can power between 400 and 500 homes. In the EIA database, the two largest wind farms under construction are the 500MW Goodnight wind farm being built in Armstrong County, TX, by FGE Goodnight that’s scheduled for completion in March 2020, and the Power Company of Wyoming’s 500MW Chokecherry and Sierra Madre wind farm in Carbon, WY, scheduled for completion in 2024.
The solar farms listed by EIA are quite a bit smaller, with only five generating facilities of 200 MW or more. The largest, the 240MW Misae Power facility in Childress, TX, owned by Childress Solar Park, is scheduled for completion this December.The Solar Energy Industries Association (SEIA) says the national average for the number of homes that can be powered per megawatt of solar power is 190, but cautions that here are many variables to consider including the dramatic differences in the use of air conditioning and electric heat, as well as the size of home. But using the SEIA calculation, a 100MW solar farm can power 19,000 homes.
To learn more about the projects in the EIA database, click on the green box below. To see them in a map format, you can either click here or on the map below. The link takes you to an interactive map where you can click on specific projects. Additional navigation tools are on the left of the map, while filtering options are to the right of the map.
Need more construction project data? Check out our special $99 annual subscription rate for Electrical Marketing newsletter. It includes acdess to our database of more than 800 construction projects either underway or on the drawing boards. Click here to subscribe, or contact Jim Lucy, Content Director at 913-967-1743 or [email protected].
About the Author
Jim Lucy Blog
Chief Editor
Jim Lucy has been wandering through the electrical market for more than 30 years, most of the time as an editor for Electrical Wholesaling, Electrical Marketing newsletter and CEE News. During that time he and the editorial team for the publications have won numerous national awards for their coverage of the electrical business. He showed an early interest in electricity, when as a youth he had an idea for a hot dog cooker. Unfortunately, the first crude prototype malfunctioned and the arc nearly blew him out of his parents' basement. Before becoming an editor for Electrical Wholesaling magazine and Electrical Marketing, he earned a BA degree in journalism and a MA in communications from Glassboro State College, Glassboro, NJ., which is formerly best known as the site of the 1967 summit meeting between President Lyndon Johnson and Russian Premier Aleksei Nikolayevich Kosygin, and now best known as the New Jersey state college that changed its name in 1992 to Rowan University because of a generous $100 million donation by N.J. zillionaire industrialist Henry Rowan. Jim is a Brooklyn-born Jersey Guy happily transplanted in the fertile plains of Kansas for the past 20 years.

