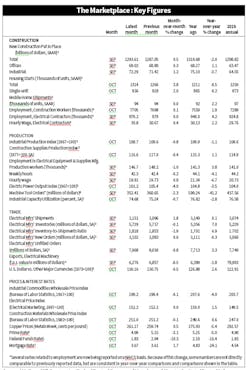
PMI inches up in October. The October Purchasing Managers Index (PMI) increased a half point to 48.3%, up from the September reading of 47.8% percent, but still below the 50% mark indicating a bullish purchasing environment. The PMI survey of industrial purchasing managers is published monthly by the Institute for Supply Management (ISM), Tempe, AZ.
Oil market still not out of rough patch. The Baker Hughes Rig Count was down nine rigs for the week ending Nov. 15, continuing to reflect contraction in the North American oil industry. The Rig Count currently stands at 793 rigs in North America, down 274 rigs from last year at this time.
At 408 oil rigs, Texas has seen the biggest YOY dip in 2019, with 127 less rigs operating than in Nov. 2018. The famed Permian Oil basin is seeing most of this decline, with 85 fewer rigs operating than last year. Down 94 rigs from Nov. 2018, Oklahoma’s oil market has also softened.
Construction index sees solid gain in October. The Dodge Momentum Index increased 6.9% in October to 152.6 (2000=100) from the revised September reading of 142.7. The Momentum Index, published monthly by Dodge Data & Analytics, is a measure of the first (or initial) report for nonresidential building projects in planning, which have been shown to lead construction spending for nonresidential buildings by a full year. October’s increase was due entirely to a recovery in institutional planning projects, which had stepped back over the previous few months. Institutional planning moved +22.8% higher in the month while commercial planning lost -0.5%.
Despite the October increase, institutional projects entering planning remain -4.3% lower on a YOY basis compared to Oct. 2018. Commercial projects meanwhile are +14.3% higher than October 2018.


