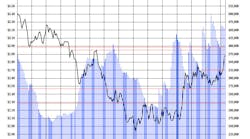
Copper has done very well for itself this year, up 73 cents, or 34% from last August, and +39 cents, or +16% on a year to date basis. Interestingly though, the price seems to be ignoring rising inventories that have climbed 71% from last year, and are up 13% this year.
Also, on this side of the equation, the Comex component of stocks is up nearly 100,000 MT from last year. And we had to dig pretty far back in our records to see that this is the highest level of Comex inventories since 2004. Not total inventories mind you, just the Comex side. Not sure what this means in the grand scheme of things though.
In any event, as the copper chart clearly illustrates, the relationship between prices and inventories went out the window a long time ago. So, if we focus specifically on the price itself, copper stands at its highest level since May 2016, and is now facing the critical challenge of its previous high at $2.95.
With the market closing at $2.8850 on Friday, copper is just 6 cents away from victory, which would set up a test of the psychologically important $3.00 level. But let’s not get too far ahead of ourselves, as there a few other indicators that tell us copper is very, very overbought here, suggesting that a correction is overdue.
And coincidently, an article in this week’s Barron’s sums up the reasons why copper has risen, and also points out potential pitfalls, with the conclusion that the current price is too high, and will decline by year end.
If in the event copper does get past the $2.95 level, which incidentally is a double top formation, it will encounter even more difficulty just below $3.00, where “old support has become new resistance.” Could it be that we will soon see what happens, when an “unstoppable force meets an immovable object”?
If you would like to learn more about how to manage your wire and cable inventory in this volatile market environment, e-mail John at by clicking here.


