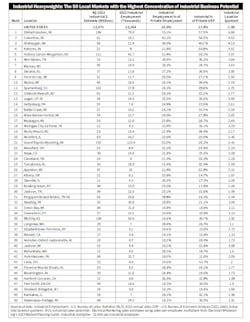
50 Small MSAs Where Industrial Business Rules — And Accounts for $2.5 Billion in Potential
EM’s editors found that 22 of these markets are in the Industrial Midwest, and that one of them — the Elkhart-Goshen, MSA — relies on manufacturing businesses for more than half of all its private employment. Industrial employment in this market, an area known for the manufacture of recreational trailers, accounted for 53.1% of jobs in private industry, far surpassing the national average of 10%. And when you measure this market by the industrial market’s contributions to private industry GMP, the story was similar at 57.9%. The similarities also run true when you measure this local market by its industrial location quotient, which according the U.S. Bureau of Labor Statistics (BLS) www.bls.gov, “compares the concentration of an industry within a specific area to the concentration of that industry nationwide.” The Elkhart-Goshen MSA, which accounts for the majority of the nation’s RV manufacturing, has an industrial location quotient that’s six times the national average.
One application for this data in the electrical market is to find out which local markets may have more potential customers for a specific product. Let’s say you are an electrical manufacturer launching a new product specifically designed for the oil & gas industry. You can visit the BLS website and download the oil & gas industry employment data and location quotients to see which counties, MSAs and states have a high proportion of oil & gas sales employment or companies compared to the national average. This data might help you concentrate your sales force’s selling time in the market areas with the highest LQs for the oil & gas market.
While local salespeople often know exactly where end-use markets are most concentrated, it’s nice to have data to back up that intuition when you are working with regional managers who many not be familiar with your local market.
About the Author
Jim Lucy
Editor-in-Chief
Over the past 40-plus years, hundreds of Jim’s articles have been published in Electrical Wholesaling and Electrical Marketing newsletter on topics such as the impact of new competitors on the electrical market’s channels of distribution, energy-efficient lighting and renewables, and local market economics. In addition to his published work, Jim regularly gives presentations on these topics to C-suite executives, industry groups and investment analysts.
He launched a new subscription-based data product for Electrical Marketing that offers electrical sales potential estimates and related market data for more than 300 metropolitan areas, and in 1999 he published his first book, “The Electrical Marketer’s Survival Guide” for electrical industry executives looking for an overview of key market trends.
While managing Electrical Wholesaling’s editorial operations, Jim and the publication’s staff won several Jesse H. Neal awards for editorial excellence, the highest honor in the business press, and numerous national and regional awards from the American Society of Business Press Editors. He has a master’s degree in Communications and a bachelor’s degree in Journalism from Glassboro State College, Glassboro, N.J. (now Rowan University).


