Commerce Data Shows $900 Billion in New Construction During July, Up 5.2% YTY
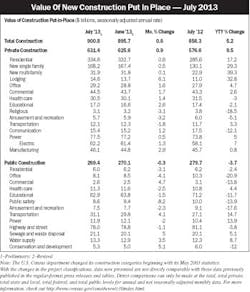
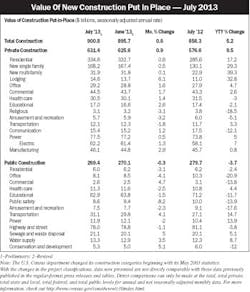
The Department of Commerce said construction spending during July 2013 was estimated at a seasonally adjusted annual rate of $900.8 billion, 0.6% above the revised June estimate of $895.7 billion and 5.2% above the July 2012 estimate of $856.3 billion. During the first seven months of this year, construction spending amounted to $493.9 billion, 5.6% above the $467.7 billion for the same period in 2012.
Private construction. Spending on private construction was at a seasonally adjusted annual rate of $631.4 billion, 0.9% above the revised June estimate of $625.6 billion. Residential construction was at a seasonally adjusted annual rate of $334.6 billion in July, 0.6% above the revised June estimate of $332.7 billion. Nonresidential construction was at a seasonally adjusted annual rate of $296.8 billion in July, 1.3% above the revised June estimate of $293.0 billion.
An analysis of this data by Associated General Contractors, Washington, D.C., highlighted the sectors with substantial increases since July 2012, including lodging (+33%); warehouses, (+11%); and the largest private nonresidential category, power (+5%), which includes oil and gas as well as electricity. AGC also noted the large decreases in private health care construction, down 3%; and communication, down 12%.
Public construction. In July, the estimated seasonally adjusted annual rate of public construction spending was $269.4 billion, 0.3% below the revised June estimate of $270.1 billion. Educational construction was at a seasonally adjusted annual rate of $62.9 billion, 1.5% below the revised June estimate of $63.8 billion.

