Latest from Market Sales Estimates

Datawrapper / Jim Lucy
county_promo
Check out the counties with the most estimated electrical sales potential.
May 9, 2025
Today's Electrical Sales Potential Leaders - Metro Level
Epiosode #113 of the Today's Electrical Economy podcast will look at the metropolitan areas with the biggest increases in sales potential and building permit activity. Sponsored...
Feb. 13, 2025
© Endeavor Business Media
county_population1920
11 metros saw an estimated total sales increase of $50 million or more.
Feb. 13, 2025
www.datawrapper.de
msa_sales_map_092024
This articles explores sales potential estimates in the eastern region of the United States.
Dec. 5, 2024
Datawrapper.de & Jim Lucy
us_map_testthree_done
At the state level, the states in the Western region currently growing the fastest are Alaska (+15.1%); Hawaii (+11.1%); Nevada (+9.5%); Montana (+8%); Oklahoma (+5.6%); Utah,...
Dec. 5, 2024
Leading Economic Indicators for the Electrical Market
Episode 105 of Electrical Wholesaling's Today’s Electrical Economy podcast series sponsored by Champion Fiberglass analyzes several key market indicators and looks at a state ...
Oct. 10, 2024
www.datawrapper.de
state_map3
On the state level, the 10 largest states account for 51% of all sales and the five largest states account for 35%.
Sept. 26, 2024
www.datawrapper.de
electrician_employment_image
The most recent BLS download on electricians showed that electrician employment through May 2023 hit 712,580 and increased +3.3% on a national basis with an increase of 22,530...
Sept. 12, 2024
www.datawrapper.de
q3wr5top100smallcountiestowatchin2025_1920
Check out our picks for the fastest-growing counties or download the local market data for more than 1,500 U.S. Counties.
Sept. 4, 2024

August Construction Spending Logs Positive YTD Growth Numbers with +10.9% Boost

Oct. 6, 2022
2 min read
San Diego Construction1024 633f15f805748

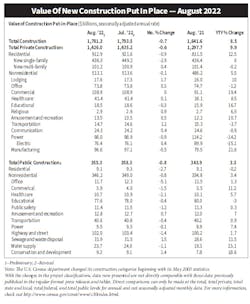
Total construction spending during Aug. 2022 was estimated at a seasonally adjusted annual rate of $1,781.3 billion, -0.7% below the revised July estimate of $1,793.5 billion. According to the U.S. Census Bureau, the August figure is +8.5% above the Aug. 2021 estimate of $1,641.6 billion. During the first eight months of 2022, construction spending amounted to $1,183.8 billion, +10.9% $1,067.4 billion for the same period in 2021.

Private construction

Spending on private construction was at a seasonally adjusted annual rate of $1,426 billion, -0.6% below the revised July estimate of $1,435.2 billion. Residential construction was at a seasonally adjusted annual rate of $912.9 billion in August, -0.9% below the revised July estimate of $921.6 billion. Nonresidential construction was at a seasonally adjusted annual rate of $513.1 billion in August, -0.1% below the revised July estimate of $513.6 billion. Private manufacturing once again led all other construction categories in year-over-year comparisons in August, tracking at a +21.6% increase over Aug. 2021 despite a -0.5% drop to $96.6 billion for the month. The Computer/electronic/electrical category was up +3.7% for the month to $30,743 million — a whopping +179.2% increase from last August.

Public construction

In August, the estimated seasonally adjusted annual rate of public construction spending was $355.3 billion, -0.8% below the revised July estimate of $358.3 billion. Educational construction was at a seasonally adjusted annual rate of $77.6 billion, -0.4% below the revised July estimate of $78 billion. State and local spending on schools is still soft, with a -0.3% decrease in August to $76,171 million.