Latest from Market Sales Estimates

Datawrapper / Jim Lucy
county_promo
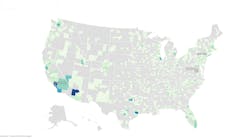
Check out the counties with the most estimated electrical sales potential.
May 9, 2025
Today's Electrical Sales Potential Leaders - Metro Level
Epiosode #113 of the Today's Electrical Economy podcast will look at the metropolitan areas with the biggest increases in sales potential and building permit activity. Sponsored...
Feb. 13, 2025
© Endeavor Business Media
county_population1920
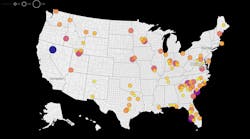
11 metros saw an estimated total sales increase of $50 million or more.
Feb. 13, 2025
www.datawrapper.de
msa_sales_map_092024
This articles explores sales potential estimates in the eastern region of the United States.
Dec. 5, 2024
Datawrapper.de & Jim Lucy
us_map_testthree_done
At the state level, the states in the Western region currently growing the fastest are Alaska (+15.1%); Hawaii (+11.1%); Nevada (+9.5%); Montana (+8%); Oklahoma (+5.6%); Utah,...
Dec. 5, 2024
Leading Economic Indicators for the Electrical Market
Episode 105 of Electrical Wholesaling's Today’s Electrical Economy podcast series sponsored by Champion Fiberglass analyzes several key market indicators and looks at a state ...
Oct. 10, 2024
www.datawrapper.de
state_map3
On the state level, the 10 largest states account for 51% of all sales and the five largest states account for 35%.
Sept. 26, 2024
www.datawrapper.de
electrician_employment_image
The most recent BLS download on electricians showed that electrician employment through May 2023 hit 712,580 and increased +3.3% on a national basis with an increase of 22,530...
Sept. 12, 2024
www.datawrapper.de
q3wr5top100smallcountiestowatchin2025_1920
Check out our picks for the fastest-growing counties or download the local market data for more than 1,500 U.S. Counties.
Sept. 4, 2024

New Construction Sees Small Monthly Decline in February But YOY Pace Stays Solid

Nonresidential construction was at a seasonally adjusted annual rate of $447.8 billion in February, -1% below the revised January estimate of $452.3 billion.
April 8, 2021
2 min read
San Diego Construction1024 606f5603a03f7

Total construction spending during Feb. 2021 was estimated at a seasonally adjusted annual rate of $1,516.9 billion, -0.8% below the revised January estimate of $1,529 billion. According to the U.S. Census Bureau, the February year-over-year (YOY) figure is +5.3% above the Feb. 2020 estimate of $1,441.1 billion. During the first two months of this year, construction spending amounted to $213.2 billion, +4.9% above the $203.2 billion for the same period in 2020.

Private construction. Spending on private construction was at a seasonally adjusted annual rate of $1,165.7 billion, -0.5% below the revised January estimate of $1,171.6 billion. Residential construction was at a seasonally adjusted annual rate of $717.9 billion in February, -0.2% below the revised January estimate of $719.3 billion. Nonresidential construction was at a seasonally adjusted annual rate of $447.8 billion in February, -1% below the revised January estimate of $452.3 billion.

Not surprisingly considering the COVID-19 environment, the Lodging (-23.9%) and Amusement & Recreation (-22.5%) lagged other construction categories on a YOY basis.

Public construction. In February, the estimated seasonally adjusted annual rate of public construction spending was $351.2 billion, -1.7% below the revised January estimate of $357.4 billion. Educational construction was at a seasonally adjusted annual rate of $86.9 billion, -3.2% below the revised January estimate of $89.8 billion. Highway construction was at a seasonally adjusted annual rate of $102.3 billion, -0.6% below the revised January estimate of $103.0 billion.