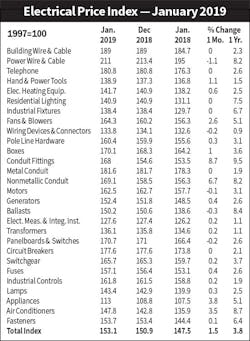
EM’s Electrical Price Index (EPI) kicked off the new year with a rather large +1.5% monthly increase over Dec. 2018 that was also up +3.8% year-over-year (YOY). Conduit fittings (+8.7%) and Nonmetallic conduit (+6.7%) saw the biggest monthly increases. Their YOY data will also catch your eye. Several smaller categories also saw increases of more than +1%, including Hand & Power Tools, Fans & Blowers, Boxes, Appliances and Air Conditioners.
Note: All EPI series represent Global Insight aggregates of Bureau of Labor Statistics’ (BLS) producer price indices (PPIs). The revised data partly reflect redefinitions of specific PPIs by the BLS, but mostly reflect the rebenchmarking of all EPI price series to a 1997 base year. The four following EPI series have been affected by BLS redefinitions: boxes, conduit (fittings), nonmetallic conduit, and generators. Sources: U.S. Bureau of Labor Statistics; Global Insight

