Latest from Electrical Price Index

Photo 199231482 / Hye Jin Kang / Dreamstime.com
prices_cost_rising_photo_199231482___hye_jin_kang_
Photo 199231482 / hye jin kang /Dreamstime.com
prices_cost_rising_photo_199231482___hye_jin_kang_
Photo 199231482 © / hye jin kang / Dreamstime.com
prices_cost_rising_photo_199231482___hye_jin_kang_
Photo 199231482 © hye jin kang / Dreamstime.com
prices_cost_rising_photo_199231482___hye_jin_kang_
Photo 199231482 © Hye Jin Kang / Dreamstime
prices_cost_rising_photo_199231482___hye_jin_kang_
199231482 ©/ hye jin kang / Dreamstime.com
Pphoto 19923148 / Hye Jin Kang / Dreamstime
Photo 199231482 / Hye Jin Kang / Dreamstime
Photo 199231482 / Ye Jin Kang / Dreamstime
Image

Electrical Prices Slide Again In December

Jan. 23, 2015
Not surprisingly, Building Wire & Cable led all categories with a -2.3% decline from November and a -5.4% decline from Dec.

Click to enlarge

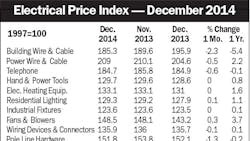
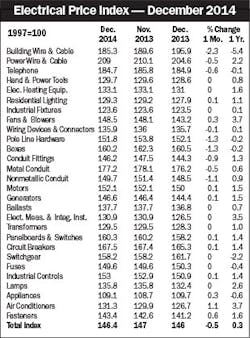
EM’s Electrical Price Index (EPI) was down a half point in December and ended the year up 0.3% over Dec. 2014. Not surprisingly, Building Wire & Cable led all categories with a -2.3% decline from November and a -5.4% decline from Dec. 2013. Power Wire & Cable was down -0.5% month-over month but up 2.2% YOY. Switchgear was also down big from Dec. 2013 with a -2.2% drop.

Note: All EPI series represent Global Insight aggregates of Bureau of Labor Statistics’ (BLS) producer price indices (PPIs). The revised data partly reflect redefinitions of specific PPIs by the BLS, but mostly reflect the rebenchmarking of all EPI price series to a 1997 base year. The four following EPI series have been affected by BLS redefinitions: boxes, conduit (fittings), non­metallic conduit, and generators. Sources: U.S. Bureau of  Labor  Statistics; Global Insight