PMI slips 3.5 points
The Purchasing Managers Index dropped 3.5 points to a still-healthy 56.2 points. Norbert Ore, chair of the Tempe, Ariz.-based Institute for Supply Management's Manufacturing Business Survey Committees said the lower reading for the PMI came from a slowing in the new orders and production indexes.
“We are now 11 months into the manufacturing recovery, and given the robust nature of recent growth, it is not surprising that we would see a slower rate of growth at this time,” he said. “The sector appears to be solidly entrenched in the recovery. Comments from the respondents remain generally positive, but expectations have been that the second half of the year will not be as strong in terms of the rate of growth, and June appears to validate that forecast.”
CEOs still bullish
The Conference Board Measure of CEO Confidence, which had decreased in the first quarter of 2010, was unchanged in the second quarter. The measure remains at 62 (a reading of more than 50 points reflects more positive than negative responses).
“CEOs' confidence held steady in the second quarter and expectations signal no change in the pace of economic growth in the coming months,” says Lynn Franco, director of The Conference Board Consumer Research Center. “The outlook for corporate profits remains optimistic, with almost half saying market/demand growth will be the principal driving force.”
Builders still singing the blues
Builder confidence in the market for newly built, single-family homes declined for a second consecutive month in July to its lowest level since April 2009, according to the National Association of Home Builders/Wells Fargo Housing Market Index (HMI). The HMI fell two points from a downwardly revised number in the previous month to 14 for July.
“We continue to see a lull in home buying activity following the expiration of the federal home buyer tax credit program, as many of the sales that would have occurred this summer were likely pulled forward to meet that program's deadline,” noted NAHB Chairman Bob Jones, a home builder from Bloomfield Hills, Mich. “In addition, builders are reporting continuing consumer hesitancy regarding home purchases due to uncertainty in the overall economy and job markets.”
The Marketplace : Key Figures
(Millions of dollars)2
(Millions of dollars)2
(Millions of dollars)2
(Millions of dollars)2
(f.a.s. millions of dollars)2
(Bureau of Labor Statistics, 1967=100)
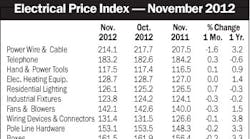
(Electrical Marketing, 1997=100)
(Bureau of Labor Statistics, 1982=100)
*Several series related to employment are now being reported on a NAICS basis. Because of this change, some numbers are not directly comparable to previously reported data, but are consistent in year-over-year comparisons and comparisons shown in the table.
Sources: 1McGraw-Hill Construction/Dodge; 2Dept. of Commerce; 3Manufactured Housing Institute; 4Dept. of Labor; 5Federal Reserve Board; 6The Association for Manufacturing Technology; 7Federal Home Loan Bank Board.
Note: Some figures shown — prime rate, for example — are averaged for month. NYA — not yet available
SA-seasonally adjusted. SAAR-seasonally adjusted annual rate. Source for chart: Global Insight.
For further information about construction starts, please contact Dodge Analytics at 1-800-591-4462

