PMI Index drops below 60 points. While still comfortably above the 50-point mark indicating a growth environment, the Purchasing Managers Index published monthly by the Institute for Supply Management (ISM), Tempe, Ariz., dropped less than a point to 59.7 points in May.
“The manufacturing sector grew for the 10th consecutive month during May,” said Norbert Ore, chair of ISM's Manufacturing Business Survey Committee. “The rate of growth as indicated by the PMI is driven by continued strength in new orders and production. Employment continues to grow as manufacturers have added to payrolls for six consecutive months.”
Help wanted advertising levels off. Online advertised vacancies were unchanged in May at 4,149,000, following a 223,000 gain in April, according to the Conference Board. “After the large 223,000 April increase in online advertised vacancies that kicked off the spring hiring season, employers essentially held steady in May,” said June Shelp, V.P. at the Conference Board. “As the economy comes out of the recession, online demand has risen in a wide variety of occupations. Occupations commonly associated with office work (administrative, legal and computer jobs) as well as manufacturing and construction vacancies are improving but remain below their pre-recession levels, while online demand for workers in sales, education and training, entertainment, food preparation and service, health-care support and personal care are all at or above their pre-recession 2007 levels.”
Builder confidence declines in June. Snapping a string of two consecutive monthly gains, builder confidence in the market for newly built, single-family homes fell back to February levels, before the beginning of the home buyer tax credit-related surge, according to results of the latest National Association of Home Builders/Wells Fargo Housing Market Index (HMI). The HMI dropped five points to 17 in June. “The home buyer tax credit did its job in stoking spring sales and we expected a temporary pull back in the builders' outlook after the credit expired at the end of April,” said NAHB Chairman Bob Jones, a home builder from Bloomfield Hills, Mich.
The Marketplace : Key Figures
Month | Latest month | Previous month | Month-over-month % change | Year ago | Year-over-year % change | 2009 annual | | CONSTRUCTION |
| New Construction Put in Place |
| (Billions of dollars, SAAR)2 |
| Offices | APR | 27.8 | 28.29 | -1.7 | 43.72 | -36.4 | 40.68 |
| Industrial | APR | 57.81 | 56.27 | 2.7 | 84.13 | -31.3 | 74.61 |
| Total | APR | 869.09 | 845.93 | 2.7 | 971.36 | -10.5 | 937.58 |
| Housing Starts (Thousands of units, SAAR)2 |
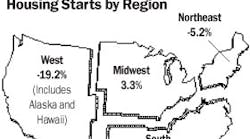
| Single-unit | MAY | 468 | 565 | -17.2 | 406 | 15.3 | 442 |
| Total | MAY | 593 | 659 | -10 | 550 | 7.8 | 554 |
| Mobile Home Shipments3 |
| (Thousands of units, SAAR) | APR | 54 | 54 | 0 | 49 | 10.2 | 50 |
| Employment, Construction Workers (Thousands)4 | MAY | 5,643 | 5,492 | 2.7 | 6,150 | -8.2 | 6,037 |
| Employment, Electrical Contractors (Thousands)4 | APR | 728.9 | 723.8 | 0.7 | 794.6 | -8.3 | 795.8 |
| Hourly Wage, Electrical Contractors4 | APR | 25.19 | 25.26 | -0.3 | 24.33 | 3.5 | 24.76 |
| PRODUCTION |
| Industrial Production Index (1967=100)5 | APR | 102.3 | 101.5 | 0.8 | 97.2 | 5.2 | 98.2 |
| Construction Supplies Production Index5 |
| (1977=100-SA) | APR | 84.3 | 82.1 | 2.8 | 82 | 2.9 | 82.3 |
| Employment in Electrical Equipment & Supplies Mfg. |
| Production workers (Thousands)4 | APR | 141.8 | 140.6 | 0.9 | 146.7 | -3.3 | 146.7 |
| Weekly hours | APR | 41.7 | 41.5 | 0.5 | 38.5 | 8.3 | 39.6 |
| Hourly wage | APR | 16.02 | 16.33 | -1.9 | 15.71 | 2 | 16.11 |
| Electric Power Output Index (1967=100)5 | APR | 105.8 | 107.1 | -1.2 | 108.5 | -2.5 | 107.5 |
| Machine Tool Orders* (Millions of dollars)6 | APR | 211.63 | 232.38 | -8.9 | 98.93 | 113.9 | - |
| Industrial Capacity Utilization (Percent, SA)1 | APR | 71.25 | 70.43 | 0.8 | 65.9 | 5.3 | 66.94 |
| TRADE |
| Electrical Mfrs' Shipments | APR | 2,897 | 2,899 | -0.1 | 2,842 | 1.9 | - |
| Electrical Mfrs' Inventories (Millions of dollars, SA)2 | APR | 4,320 | 4,260 | 1.4 | 4,681 | -7.7 | 4,475 |
| Electrical Mfrs' Inventory-to-Shipments Ratio | APR | 1.491 | 1.469 | 1.5 | 1.647 | -9.5 | 1.596 |
| Electrical Mfrs' New Orders |
| (Millions of dollars, SA)2 | APR | 3,022 | 3,326 | -9.1 | 2,726 | 10.9 | - |
| Electrical Mfrs' Unfilled Orders |
| (Millions of dollars, SA)2 | APR | 14,926 | 14,801 | 0.8 | 14,323 | 4.2 | 14,253 |
| Exports, Electrical Machinery |
| (f.a.s. value in millions of dollars)2 | APR | 6,311.00 | 6,753.00 | -6.5 | 4,811.00 | 31.2 | 63,949.00 |
| U.S. Dollar vs. Other Major Currencies (1973=100)5 | MAY | 104.6 | 101.7 | 2.9 | 106.4 | -1.7 | 105.6 |
| PRICES & INTEREST RATES |
| Industrial Commodities Wholesale Price Index |
| (Bureau of Labor Statistics, 1967=100) | MAY | 187.4 | 186.9 | 0.3 | 172 | 9 | 174.9 |
| Electrical Price Index |
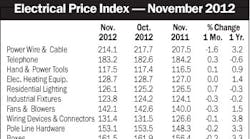
| (Electrical Marketing, 1997=100) | MAY | 138.5 | 139.3 | -0.5 | 132.8 | 4.3 | 133.1 |
| Construction Materials Wholesale Price Index |
| (Bureau of Labor Statistics, 1982=100) | MAY | 207.4 | 206 | 0.7 | 202.8 | 2.3 | 202.9 |
| Copper Prices (Metals Week, cents per pound) | JUN | 294.86 | 314.58 | -6.3 | 232.34 | 26.9 | 239.28 |
| Prime Rate5 | MAY | 3.3% | 3.3% | 0.0 | 3.3% | 0.0 | **3.3% |
| Federal Funds Rate5 | MAY | 0.2% | 0.2% | 0.0 | 0.2% | 0.0 | **0.2% |
| Mortgage Rate7 | MAY | 4.9% | 5.1% | -0.2 | 4.9% | 0.0 | 5.0% |
| *Several series related to employment are now being reported on a NAICS basis. Because of this change, some numbers are not directly comparable to previously reported data, but are consistent in year-over-year comparisons and comparisons shown in the table. |
Sources: 1McGraw-Hill Construction/Dodge; 2Dept. of Commerce; 3Manufactured Housing Institute; 4Dept. of Labor; 5Federal Reserve Board; 6The Association for Manufacturing Technology; 7Federal Home Loan Bank Board. Note: Some figures shown — prime rate, for example — are averaged for month. NYA — not yet available
SA-seasonally adjusted. SAAR-seasonally adjusted annual rate. Source for chart: Global Insight.
For further information about construction starts, please contact Dodge Analytics at 1-800-591-4462

