Thanks for stopping by Electrical Marketing’s new ESP 200 database, a new offering available only to Electrical Marketing subscribers. Named ESP 200 for the 200 MSAs (metropolitan statistical areas) with the highest electrical sales potential (ESP), these markets account for over 90% of electrical sales in the United States to the industry's two primary end-use markets – electrical contractors and industrial, comprising MRO (maintenance and repair operations), OEM (original electrical equipment) and factory automation equipment.
The ESP 200 will be updated quarterly. The forecasts utilize the sales-per-employee electrical potential formulas developed by Electrical Wholesaling for its Market Planning Guide, and trusted by EW readers over the past four decades.
This new database also includes several key indicators that drive the overall economies of these local markets: building permits, population growth, gross metropolitan product (GMP) and unemployment. These local market indicators and EM’s Electrical Sales Potential data are available in several formats:
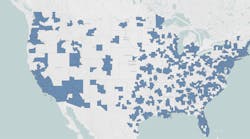
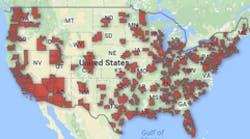
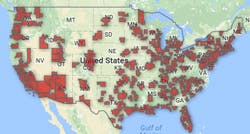
Online access via computer, tablet or smartphone (just click on “View Full List” below- When you click on the link a map of the United States will pop up with the individual MSAs highlighted in red. Just click on your area (or pinch out the map if you are using a tablet or smartphone) and an info window will pop up with that MSA's ESP data and key economic indicators. If you just want to grab an individual MSA's data you can copy and paste from the info window.


