Latest from Electrical Price Index

Photo 199231482 / Ye Jin Kang / Dreamstime
Photo 199231482 / Hye Jin Kang / Dreamstime
Photo 199231482 / Hye Jin / Kang /Dreamstime
Photo 199231482 / Hye Jin Kang / Dreamstime
199231482 / Hye Jin Kang/ Dreamstime
hye jin kang / DreamsTime
Hye Jin Kang / DreamsTime
Prices Cost Rising Photo 199231482 Hye Jin Kang Dreamstime Copy
Hye Jin Kang / DreamsTime
Prices Cost Rising Photo 199231482 Hye Jin Kang Dreamstime
Electricalmarketing 372 20160122emepi595

EM’s EPI Ends 2015 with a Thud

Jan. 22, 2016
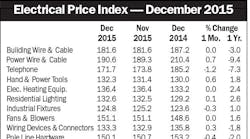
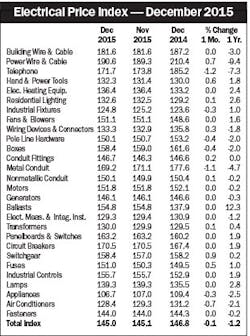
Electrical Marketing’s Electrical Price Index (EPI) slid 0.1% from Nov. 2015 and was down -1.2% year-over-year (YOY) from Dec. 2015.
Click to enlarge
Electrical Marketing’s Electrical Price Index (EPI)   slid 0.1% from Nov. 2015 and was down -1.2% year-over-year (YOY) from Dec. 2015. Telephone supplies (-1.2%) and Nonmetallic Conduit (-1.1%) were down the most for the month, while Power Wire & Cable (-9.4%), Building Wire & Cable (-3.0%) and Telephone (-7.3%) were down the most YOY. Ballasts were up a surprising 12.3% YOY.

Note: All EPI series represent Global Insight aggregates of Bureau of Labor Statistics’ (BLS) producer price indices (PPIs). The revised data partly reflect redefinitions of specific PPIs by the BLS, but mostly reflect the rebenchmarking of all EPI price series to a 1997 base year. The four following EPI series have been affected by BLS redefinitions: boxes, conduit (fittings), non­metallic conduit, and generators. Sources: U.S. Bureau of  Labor  Statistics; Global Insight