| Month | Latest month | Previous month | Month-over-month % change | Year ago | Year-over-year % change | 2008 annual | | CONSTRUCTION | | | | | | | |
| New Construction Put in Place | | | | | | | |
| (Billions of dollars, SAAR)2 | | | | | | | |
| Offices | NOV | 60.69 | 60.12 | 0.9 | 57.82 | 5.0 | NA |
| Industrial | NOV | 76.55 | 73.94 | 3.5 | 47.16 | 62.3 | NA |
| Total | NOV | 1,078.39 | 1,085.29 | -0.6 | 1,115.33 | -3.3 | NA |
| Housing Starts (Thousands of units, SAAR)2 | | | | | | | |
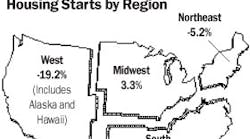
| Single-unit | DEC | 398 | 460 | -13.5 | 779 | -48.9 | 618 |
| Total | DEC | 550 | 651 | -15.5 | 1,000 | -45.0 | 902 |
| Mobile Home Shipments3 | | | | | | | |
| (Thousands of units, SAAR) | OCT | 70 | 77 | -9.1 | 94 | -25.5 | NA |
| Employment, Construction Workers (Thousands)4 | DEC | 6,706 | 7,049 | -4.9 | 7,353 | -8.8 | 7,175 |
| Employment, Electrical Contractors (Thousands)4 | NOV | 900.7 | 917.9 | -1.9 | 933.5 | -3.5 | NA |
| Hourly Wage, Electrical Contractors4 | NOV | 24.79 | 24.40 | 1.6 | 23.56 | 5.2 | NA |
| PRODUCTION | | | | | | | |
| Industrial Production Index (1967=100)5 | DEC | 103.6 | 105.7 | -2.0 | 112.4 | -7.8 | 109.5 |
| Construction Supplies Production Index5 | | | | | | | |
| (1977=100-SA) | DEC | 89.7 | 92.8 | -3.4 | 104.2 | -14.0 | 99.5 |
| Employment in Electrical Equipment & Supplies Mfg. | | | | | | | |
| Production workers (Thousands)4 | NOV | 152.9 | 153.1 | -0.1 | 154.1 | -0.8 | NA |
| Weekly hours | NOV | 41.7 | 42.1 | -1.0 | 42.7 | -2.3 | NA |
| Hourly wage | NOV | 15.90 | 15.79 | 0.7 | 15.66 | 1.5 | NA |
| Electric Power Output Index (1967=100)5 | DEC | 110.6 | 110.9 | -0.2 | 109.7 | 0.8 | 110.4 |
| Machine Tool Orders* (Millions of dollars)6 | NOV | 170.49 | 269.68 | -36.8 | 363.72 | -53.1 | NA |
| Industrial Capacity Utilization (Percent, SA)1 | DEC | 70.08 | 71.85 | -1.8 | 79.23 | -9.2 | 75.92 |
| TRADE | | | | | | | |
| Electrical Mfrs' Shipments | NOV | 3,140 | 3,427 | -8.4 | 3,486 | -9.9 | NA |
| Electrical Mfrs' Inventories (Millions of dollars, SA)2 | NOV | 5,177 | 5,284 | -2.0 | 5,005 | 3.4 | NA |
| Electrical Mfrs' Inventory-to-Shipments Ratio | NOV | 1.649 | 1.542 | 6.9 | 1.436 | 14.8 | NA |
| Electrical Mfrs' New Orders | | | | | | | |
| (Millions of dollars, SA)2 | NOV | 2,844 | 3,050 | -6.8 | 3,633 | -21.7 | NA |
| Electrical Mfrs' Unfilled Orders | | | | | | | |
| (Millions of dollars, SA)2 | NOV | 14,972 | 15,268 | -1.9 | 15,306 | -2.2 | NA |
| Exports, Electrical Machinery | | | | | | | |
| (f.a.s. value in millions of dollars)2 | NOV | 6,366.0 | 7,376.0 | -13.7 | 6,874.0 | -7.4 | NA |
| U.S. Dollar vs. Other Major Currencies (1973=100)5 | DEC | 108.5 | 109.6 | -1.1 | 99.3 | 9.3 | 99.8 |
| PRICES & INTEREST RATES | | | | | | | |
| Industrial Commodities Wholesale Price Index | | | | | | | |
| (Bureau of Labor Statistics, 1967=100) | DEC | 172.6 | 179.0 | -3.6 | 180.7 | -4.5 | 192.4 |
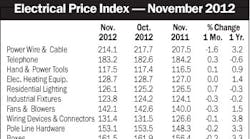
| Electrical Price Index | | | | | | | |
| (Electrical Marketing, 1997=100) | DEC | 130.1 | 129.6 | 0.4 | 132.2 | -1.6 | 135.1 |
| Construction Materials Wholesale Price Index | | | | | | | |
| (Bureau of Labor Statistics, 1982=100) | DEC | 207.6 | 210.3 | -1.3 | 193.4 | 7.3 | 205.4 |
| Copper Prices (Metals Week, cents per pound) | JAN | 152.74 | 142.79 | 7.0 | 323.68 | -52.8 | 317.30 |
| Prime Rate5 | DEC | 3.6% | 4.0% | -0.4 | 7.3% | -3.7 | **5.1% |
| Federal Funds Rate5 | DEC | 0.2% | 0.4% | -0.2 | 4.2% | -4.1 | **1.9% |
| Mortgage Rate7 | DEC | 5.3% | 6.1% | -0.8 | 6.1% | -0.8 | 6.0% |
| *Several series related to employment are now being reported on a NAICS basis. Because of this change, some numbers are not directly comparable to previously reported data, but are consistent in year-over-year comparisons and comparisons shown in the table. |
Sources: 1McGraw-Hill Construction/Dodge; 2Dept. of Commerce; 3Manufactured Housing Institute; 4Dept. of Labor; 5Federal Reserve Board; 6The Association for Manufacturing Technology; 7Federal Home Loan Bank Board.
Note: Some figures shown — prime rate, for example — are averaged for month. NYA — not yet available
SA-seasonally adjusted. SAAR-seasonally adjusted annual rate. Source for chart: Global Insight.
For further information about construction starts, please contact Dodge Analytics at 1-800-591-4462 |

