ABI takes a small step forward in February
During the first two months of 2011, the Architecture Billings Index (ABI) is not as strong as in the final quarter of 2010. As a leading economic indicator of construction activity, the ABI reflects the approximate nine- to twelve-month lag time between architecture billings and construction spending. The American Institute of Architects (AIA), Washington, D.C., reported the February ABI score was 50.6 points, up slightly from a reading of 50 points the previous month. This score reflects a modest increase in demand for design services (any score above 50 points indicates an increase in billings). The new projects inquiry index was 56.4 points, compared to a mark of 56.5 points in January.
“Overall demand for design services seems to be treading water over the last two months,” said AIA Chief Economist, Kermit Baker. “We've been preaching patience and cautious optimism for a full recovery because there continues to be a wide range of business conditions for architecture firms that are also influenced by firm size, practice specialties and regional location. We still expect the road to recovery to move at a slow, but steady pace.”
NAHB homebuilders nervous about February data
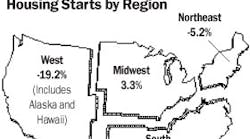
With total building permits falling 8.2 percent to a record low pace of 517,000 units in February, homebuilders are frustrated by the on-again, off-again recovery in the housing market. Single-family building permits posted a 9.3 percent drop to 382,000 units, the multi-family sector posted a 4.9 percent drop to 135,000 units, and regional declines amounted to 27.8 percent in the Northeast, 5.4 percent in the Midwest, 1.4 percent in the South and 13.6 percent in the West.
Said NAHB Chief Economist David Crowe, “While our latest member surveys showed a slight uptick in expectations for the future, there are just too many uncertainties out there for most builders and buyers to comfortably move forward with a new-home project at this time. We need to see several months of consistent improvement in economic factors, plus concrete signs that the flow of credit to housing is improving for the industry to return to a steady recovery and facilitate job growth.”
Added Bob Nielsen, NAHB chairman and a home builder from Reno, Nev., “In an already-fragile market where credit for building and buying homes remains extremely tight, additional concerns about energy costs, interest rates and other factors are contributing to an atmosphere in which many have adopted a very cautious stance.”
The Marketplace : Key Figures
Sources: 1McGraw-Hill Construction/Dodge; 2Dept. of Commerce; 3Manufactured Housing Institute; 4Dept. of Labor; 5Federal Reserve Board; 6The Association for Manufacturing Technology; 7Federal Home Loan Bank Board.
Note: Some figures shown — prime rate, for example — are averaged for month. NYA — not yet available SA-seasonally adjusted. SAAR-seasonally adjusted annual rate. Source for chart: Global Insight.
For further information about construction starts, please contact Dodge Analytics at 1-800-591-4462

