Electrical Marketing's Key Economic Indicators

Jan. 27, 2012
ABI remains in growth territory After showing struggling business conditions for most of 2011, the Architecture Billings Index (ABI) has now reached positive

ABI remains in growth territory

After showing struggling business conditions for most of 2011, the Architecture Billings Index (ABI) has now reached positive terrain in consecutive months. As a leading economic indicator of construction activity, the ABI reflects the approximate nine- to twelve-month lag time between architecture billings and construction spending. The American Institute of Architects (AIA), Washington, D.C., reported the December ABI score was 52 points, following the exact same mark in November. This score reflects an overall increase in demand for design services (any score above 50 indicates an increase in billings). The new projects inquiry index was 64 points, down just a point from a reading of 65 points the previous month.

“We saw nearly identical conditions in November and December of 2010 only to see momentum sputter and billings fall into negative territory as we moved through 2011, so it's too early to be sure that we are in a full recovery mode,” said AIA Chief Economist, Kermit Baker. “Nevertheless, this is very good news for the design and construction industry and it's entirely possible conditions will slowly continue to improve as the year progresses.”

Purchasing Managers Index increases 1.2 points in December to 53.9 percent

In a press release announcing the December PMI results, Bradley Holcomb, chair of the Tempe, Ariz.-based Institute for Supply Management's Manufacturing Business Survey Committee, said, “Manufacturing is finishing out the year on a positive note, with new orders, production and employment all growing in December at faster rates than in November, and with an optimistic view toward the beginning of 2012 as reflected by the panel in this month's survey,”

Railroads hauling more freight in January

The Association of American Railroads (AAR) reported an increase in weekly rail traffic for the week ending January 14, with U.S. railroads originating 298,560 carloads, up 5.5 percent compared with the same week last year.

The Marketplace: Key Figures

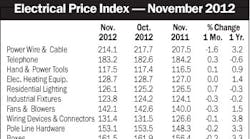
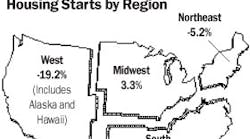
Month Latest month Previous month Month-over-month % change Year ago Year-over-year % change 2011 annual CONSTRUCTIONNew Construction Put in Place (Billions of dollars, SAAR)2 Total NOV 807.11 797.42 1.2 802.98 0.5 Offices NOV 22.85 23.16 -1.3 22.34 2.3 Industrial NOV 36.87 37.39 -1.4 32.75 12.6 Housing Starts DEC 657 685 -4.1 526 24.9 607 Single-unit DEC 470 450 4.4 421 11.6 429 Mobile Homes NOV 64 61 4.9 44 45.5 Employment, Construction DEC 5,436 5,659 -3.9 5,387 0.9 5,526 Employment, electrical NOV 743.4 745.2 -0.2 731.6 1.6 Hourly Wage NOV 25.85 25.79 0.2 25.32 2.1 PRODUCTIONIndustrial Production Index (1967=100)5 DEC 95.3 94.9 0.4 92.6 2.9 93.8 Construction Supplies Production Index5 (1997=100-SA) DEC 77.9 77.1 1 74.4 4.6 76.3 Employment, in Electrical Equipment & Supplies Mfg. Production Workers (Thousands)4 NOV 141.2 141.1 0.1 137 3.1 Weekly Hours NOV 43.8 42.9 2.1 42.8 2.3 Hourly Wage NOV 18.23 18.44 -1.1 16.64 9.6 Electrical Power Output Index (1967=100)5 DEC 98.4 100.1 -1.7 102.9 -4.4 100.8 Machine Tool Orders* (Millions of dollars)2 NOV 372.35 428.64 -13.1 298.5 24.7 Industrial Capacity Utilization (Percent, SA)1 DEC 76.39 75.8 0.6 74.17 2.2 75.38 TRADEElec. Mfr. Shipments (Millions of dollars)2 NOV 3,698 3,772 -2 3,627 2 Elec. Mfr. Inventories (Millions of dollars)2 NOV 4,878 4,813 1.4 4,934 -1.1 Elec. Mfr. I/S Ratio NOV 1.319 1.276 3.4 1.36 -3 Elec. Mfr. New Orders (Millions of dollars)2 NOV 4,118 3,914 5.2 3,982 3.4 Elec. Mfr. Unfilled Orders (Millions of dollars)2 NOV 15,086 14,666 2.9 12,901 16.9 Exports, Electrical Machinery (f.a.s. millions of dollars)2 NOV 6,542 6,722 -2.7 6,394 2.3 U.S. Dollar vs. Other Major Currencies (1973=100)5 DEC 100.5 99.5 0.9 99.8 0.7 97.2 PRICES & INTEREST RATESIndustrial Commodites Wholesale Price Index (Bureau of Labor Statistics, 1967=100) DEC 201.1 202.8 -0.8 191.3 5.1 202.2 Electrical Price Index (Electrical Marketing, 1997=100) DEC 141.6 141.6 0 141.2 0.3 142.1 Construction Materials Wholesale Price Index (Bureau of Labor Statistics, 1982=100) DEC 214.4 214.1 0.1 207 3.6 212.8 Copper Price (Metals Week, cents per pound) JAN 358.74 347.21 3.3 438.43 -18.2 404.5 Prime Rate5 DEC 3.3 3.3 0 3.3 0 3.3 Federal Funds Rate5 DEC 0.1 0.1 0 0.2 -0.1 0.1 Mortgage Rate7 DEC 4 4 0 4.7 -0.8 4.5 *Several series related to employment are now being reported on a NAICS basis. Because of this change, some numbers are not directly comparable to previously reported data, but are consistent in year-over-year comparisons and comparisons shown in the table.

Sources: 1McGraw-Hill Construction/Dodge; 2Dept. of Commerce; 3Manufactured Housing Institute; 4Dept. of Labor; 5Federal Reserve Board; 6The Association for Manufacturing Technology; 7Federal Home Loan Bank Board.
Note: Some figures shown — prime rate, for example — are averaged for month. NYA — not yet available
SA-seasonally adjusted. SAAR-seasonally adjusted annual rate. Source for chart: Global Insight.
For further information about construction starts, please contact Dodge Analytics at 1-800-591-4462