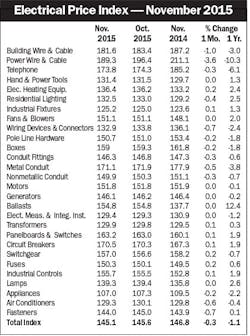
Electrical Marketing’s Electrical Price Index (EPI) took another step down in September to 145.1, off -0.3% from October and -1.1% from Oct. 2014. Wire world saw the biggest declines, with Building Wire & Cable down -1% and Power Wire & Cable down -3.6% in November. Those categories are down -3% and -10.3% year-over-year (YOY), respectively. Ballasts are up 12.4% YOY.
Note: All EPI series represent Global Insight aggregates of Bureau of Labor Statistics’ (BLS) producer price indices (PPIs). The revised data partly reflect redefinitions of specific PPIs by the BLS, but mostly reflect the rebenchmarking of all EPI price series to a 1997 base year. The four following EPI series have been affected by BLS redefinitions: boxes, conduit (fittings), nonmetallic conduit, and generators. Sources: U.S. Bureau of Labor Statistics; Global Insight


